Writing 2 min read
Introducing: analytics and privacy mode
Read a month in Money Diary: the date range that drives every page, the monthly review, what the spending charts exclude, and privacy mode.

Zain Haroon — Full-stack Engineer
Logging is the habit. Analytics is the ten minutes at the end of the month where you find out where it all went.
The date range drives everything
The date picker in the top bar filters the whole workspace, not just one chart. Set it to June and the dashboard, the transactions page and every figure on Analytics recompute for June. Set it to the quarter and they all follow.
Most of my use is comparing two ranges. This month against last month tells you something; this month alone mostly tells you what month it is.
Wealth, in three numbers
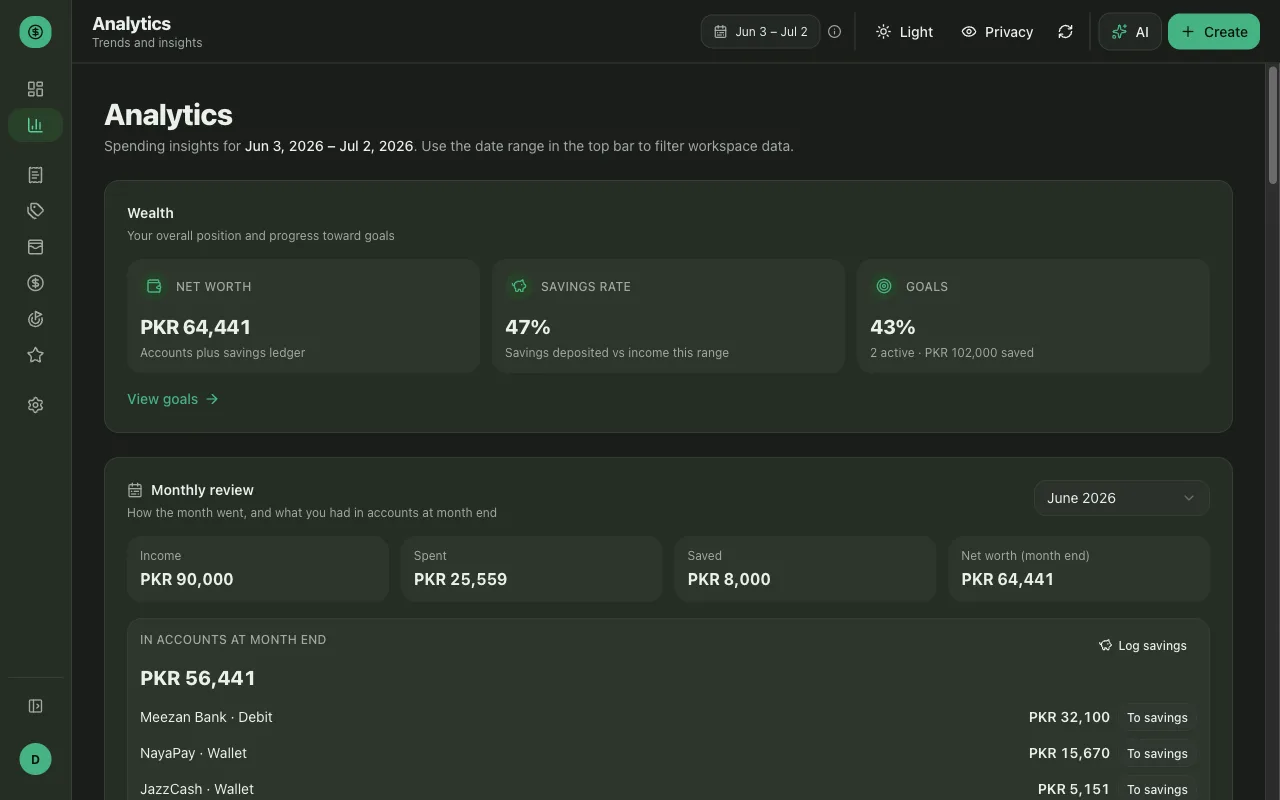
The top of the Analytics page carries three tiles:
- Net worth is your account balances plus the savings ledger.
- Savings rate is what you deposited into savings against your income for the selected range.
- Goals shows combined progress across active goals, with the count and amount underneath, like 2 active, PKR 102,000 saved.
The monthly review
Below the tiles, pick any month from the dropdown and you get four figures for it: income, spent, saved, and net worth at month end. Under that, what you were holding in each account when the month closed, with a To savings button beside each one so you can sweep what’s left straight into the savings ledger.
That’s the closest thing the app has to a monthly ritual: open the review, see what survived, move some of it into savings.
What the spending charts leave out
Three kinds of entry never count as spending, and that’s what keeps the totals matching your bank:
- Transfers between your own accounts. The money changed pockets.
- Loans you gave out. Those are receivables until they’re settled, so a 5,000 loan doesn’t read as 5,000 burned.
- Savings deposits, which live in the savings ledger.
The one habit this asks of you: when you spend from savings, log the withdrawal and the expense as two entries, or the purchase never shows up in your charts.
Categories
Every expense carries a category out of need, want, subscription, charity and other. The subscription row is the one that pays for the whole logging habit. Small monthly charges are exactly what a person forgets and a table remembers.
For a closer look, the Transactions page splits the same data by tab (income, spending, transfers) with filters and a search box, so you can go from “food is high” to the specific week that did it.
Privacy mode
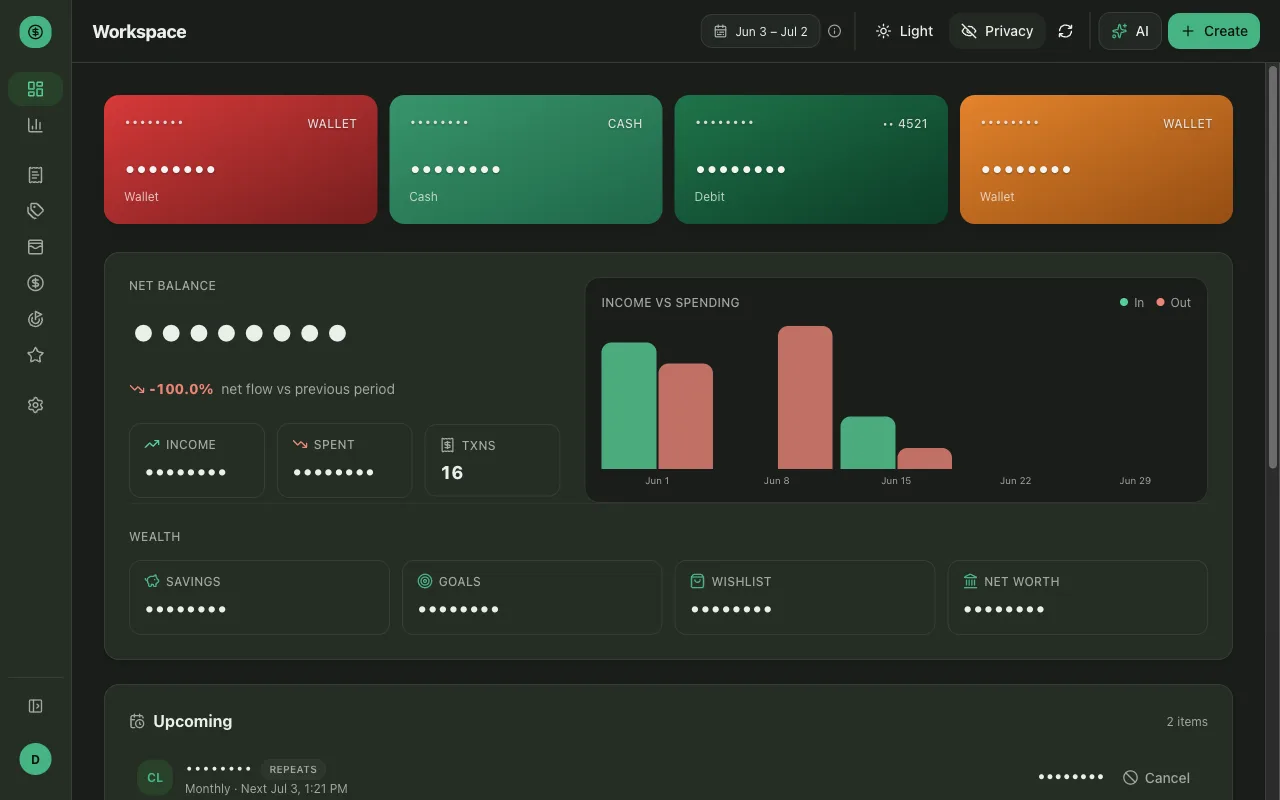
The Privacy toggle in the top bar masks every balance and figure on screen. Layout and labels stay, the numbers become dots. It’s there for checking your money on a bus, or sharing your screen without narrating your net worth.
Try it
Set the range to last month and open the monthly review. If the spent figure surprises you, the category breakdown will say why.
Money Diary is live at money-diary.zainharoon.com if you want to try it.